1. Basic Report Information
| Item | Information |
|---|---|
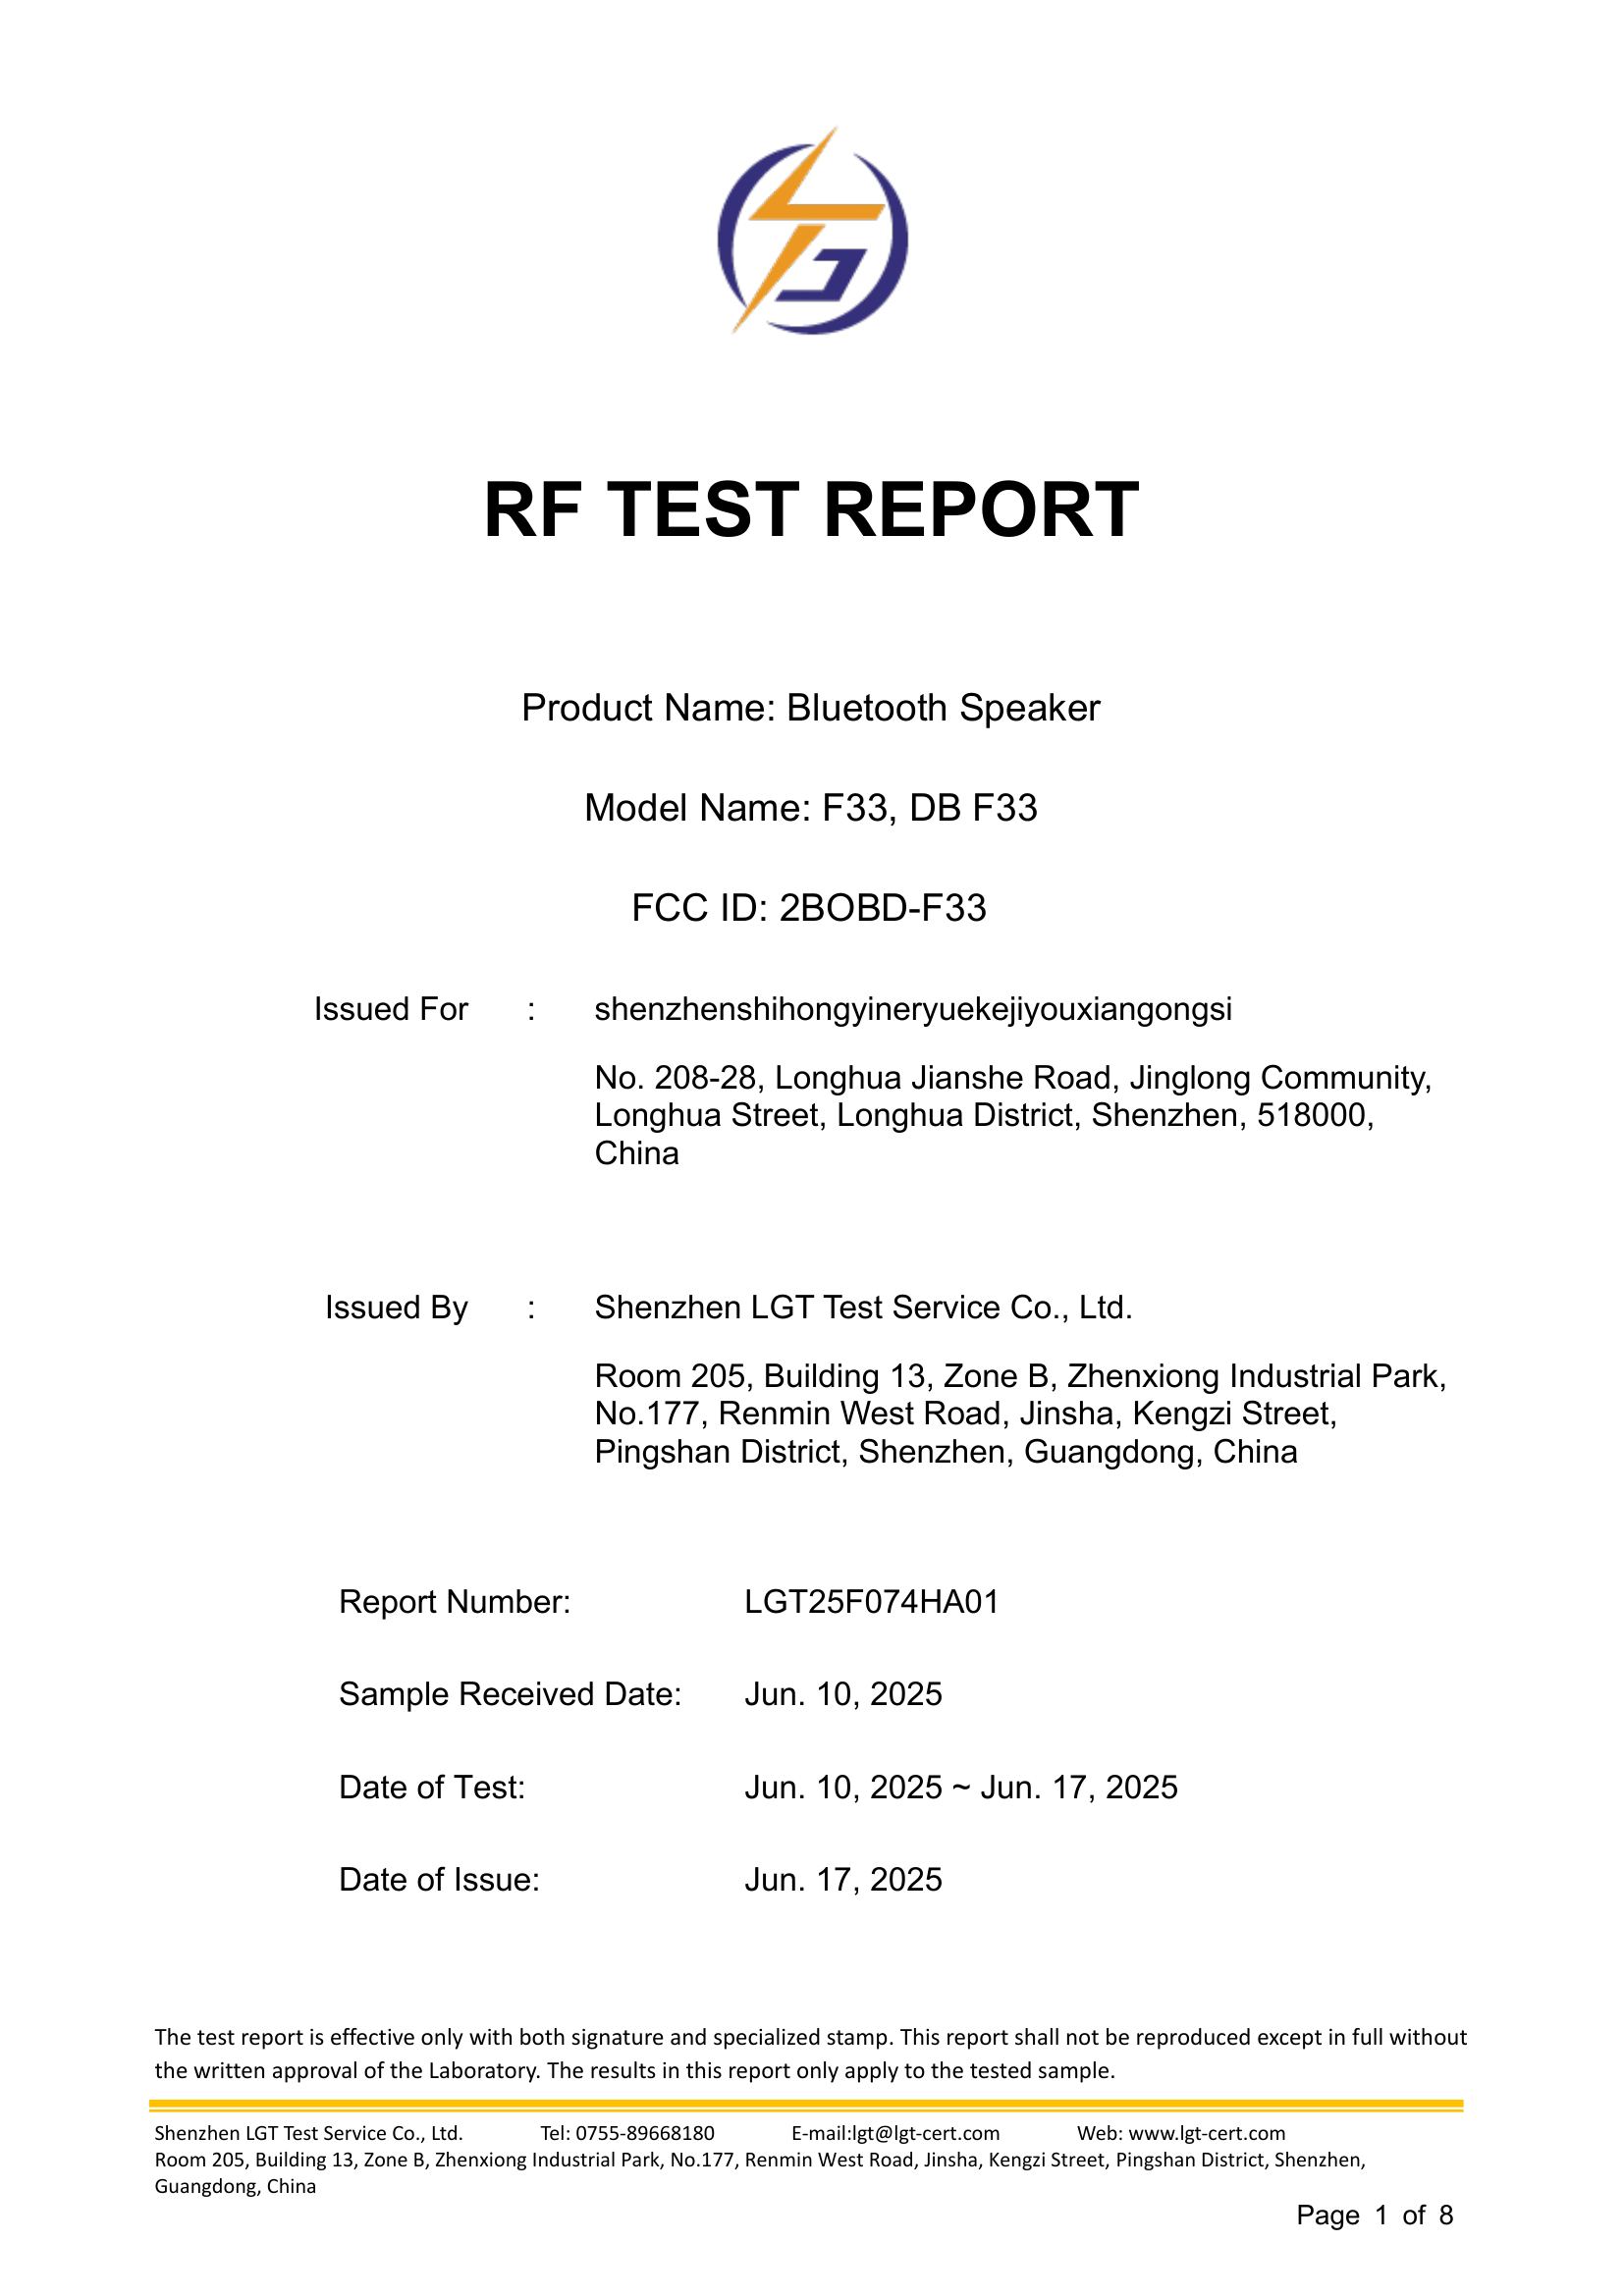
| Report name | RF TEST REPORT |
| Report number | LGT25F074HA01 |
| FCC ID | 2BOBD-F33 |
| Issuing organization | Shenzhen LGT Test Service Co., Ltd. |
| Sample receipt date | Jun. 10, 2025 |
| Test dates | Jun. 10, 2025 ~ Jun. 17, 2025 |
| Issue date | Jun. 17, 2025 |
| Version | 00 |
| Version release date | Jun. 17, 2025 |
| Revision details | Initial Issue |
| Test result | PASS |
2. Product and Applicant
| Item | Information |
|---|---|
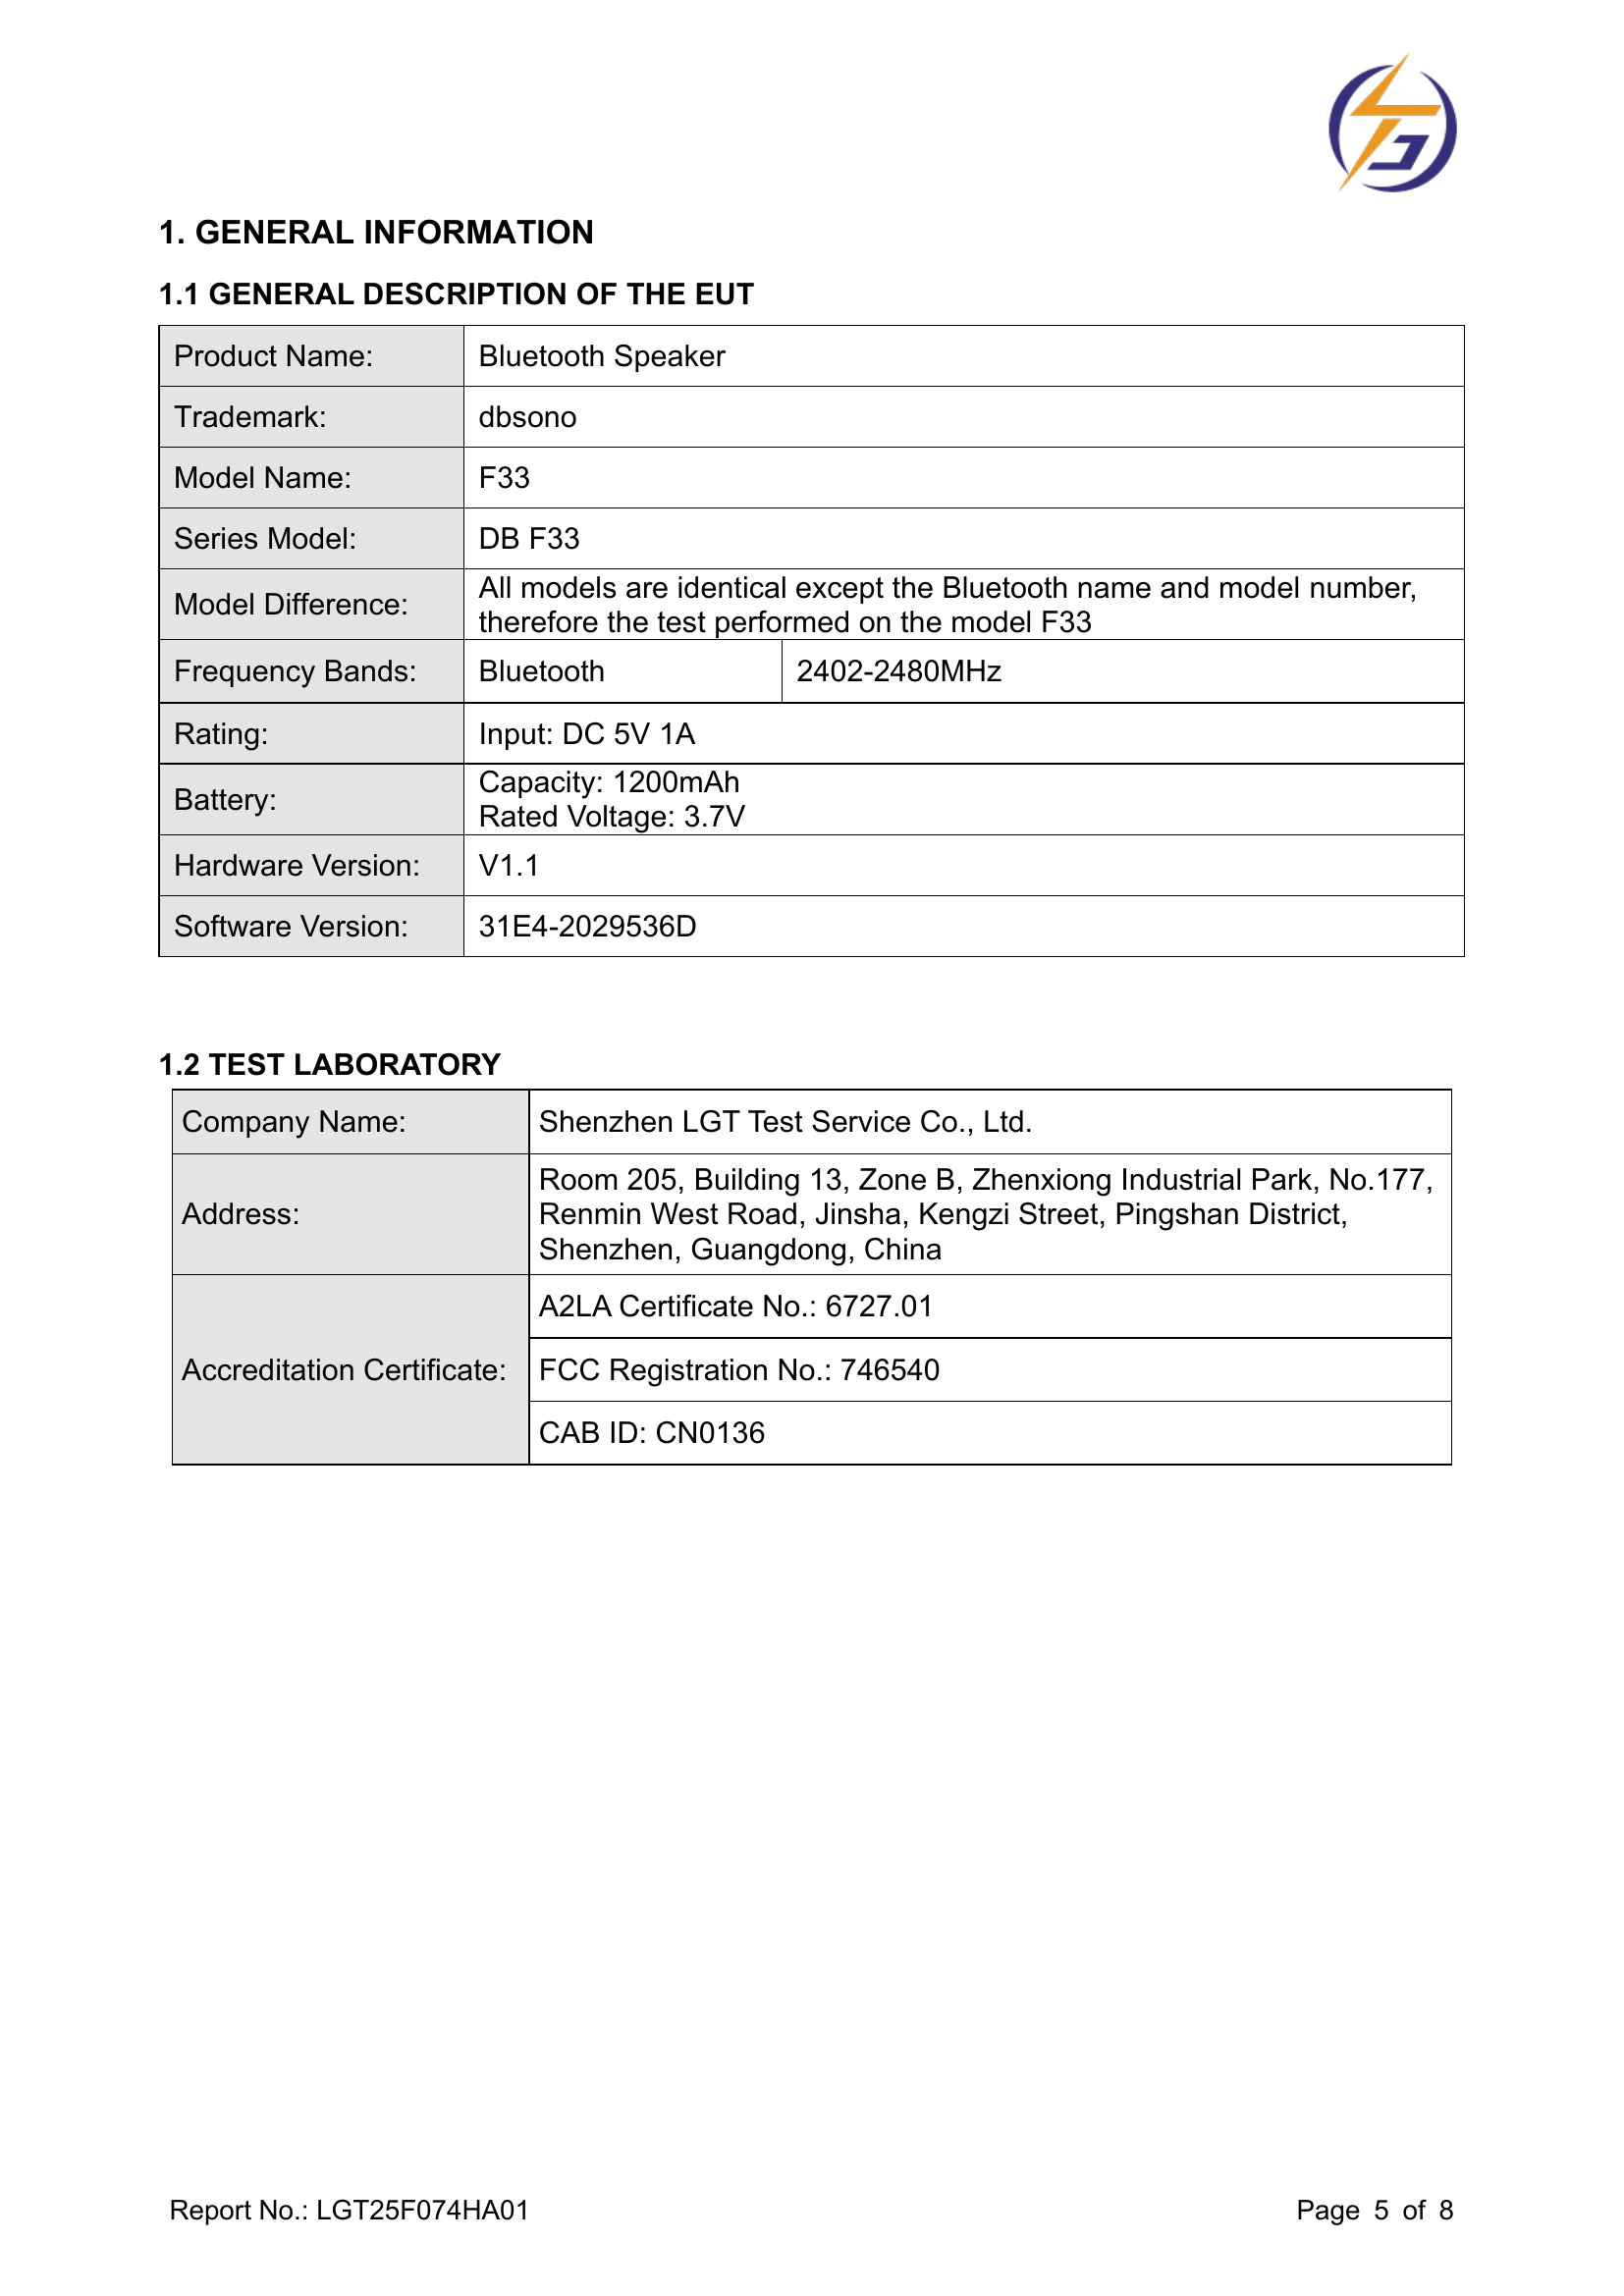
| Product name | Bluetooth Speaker |
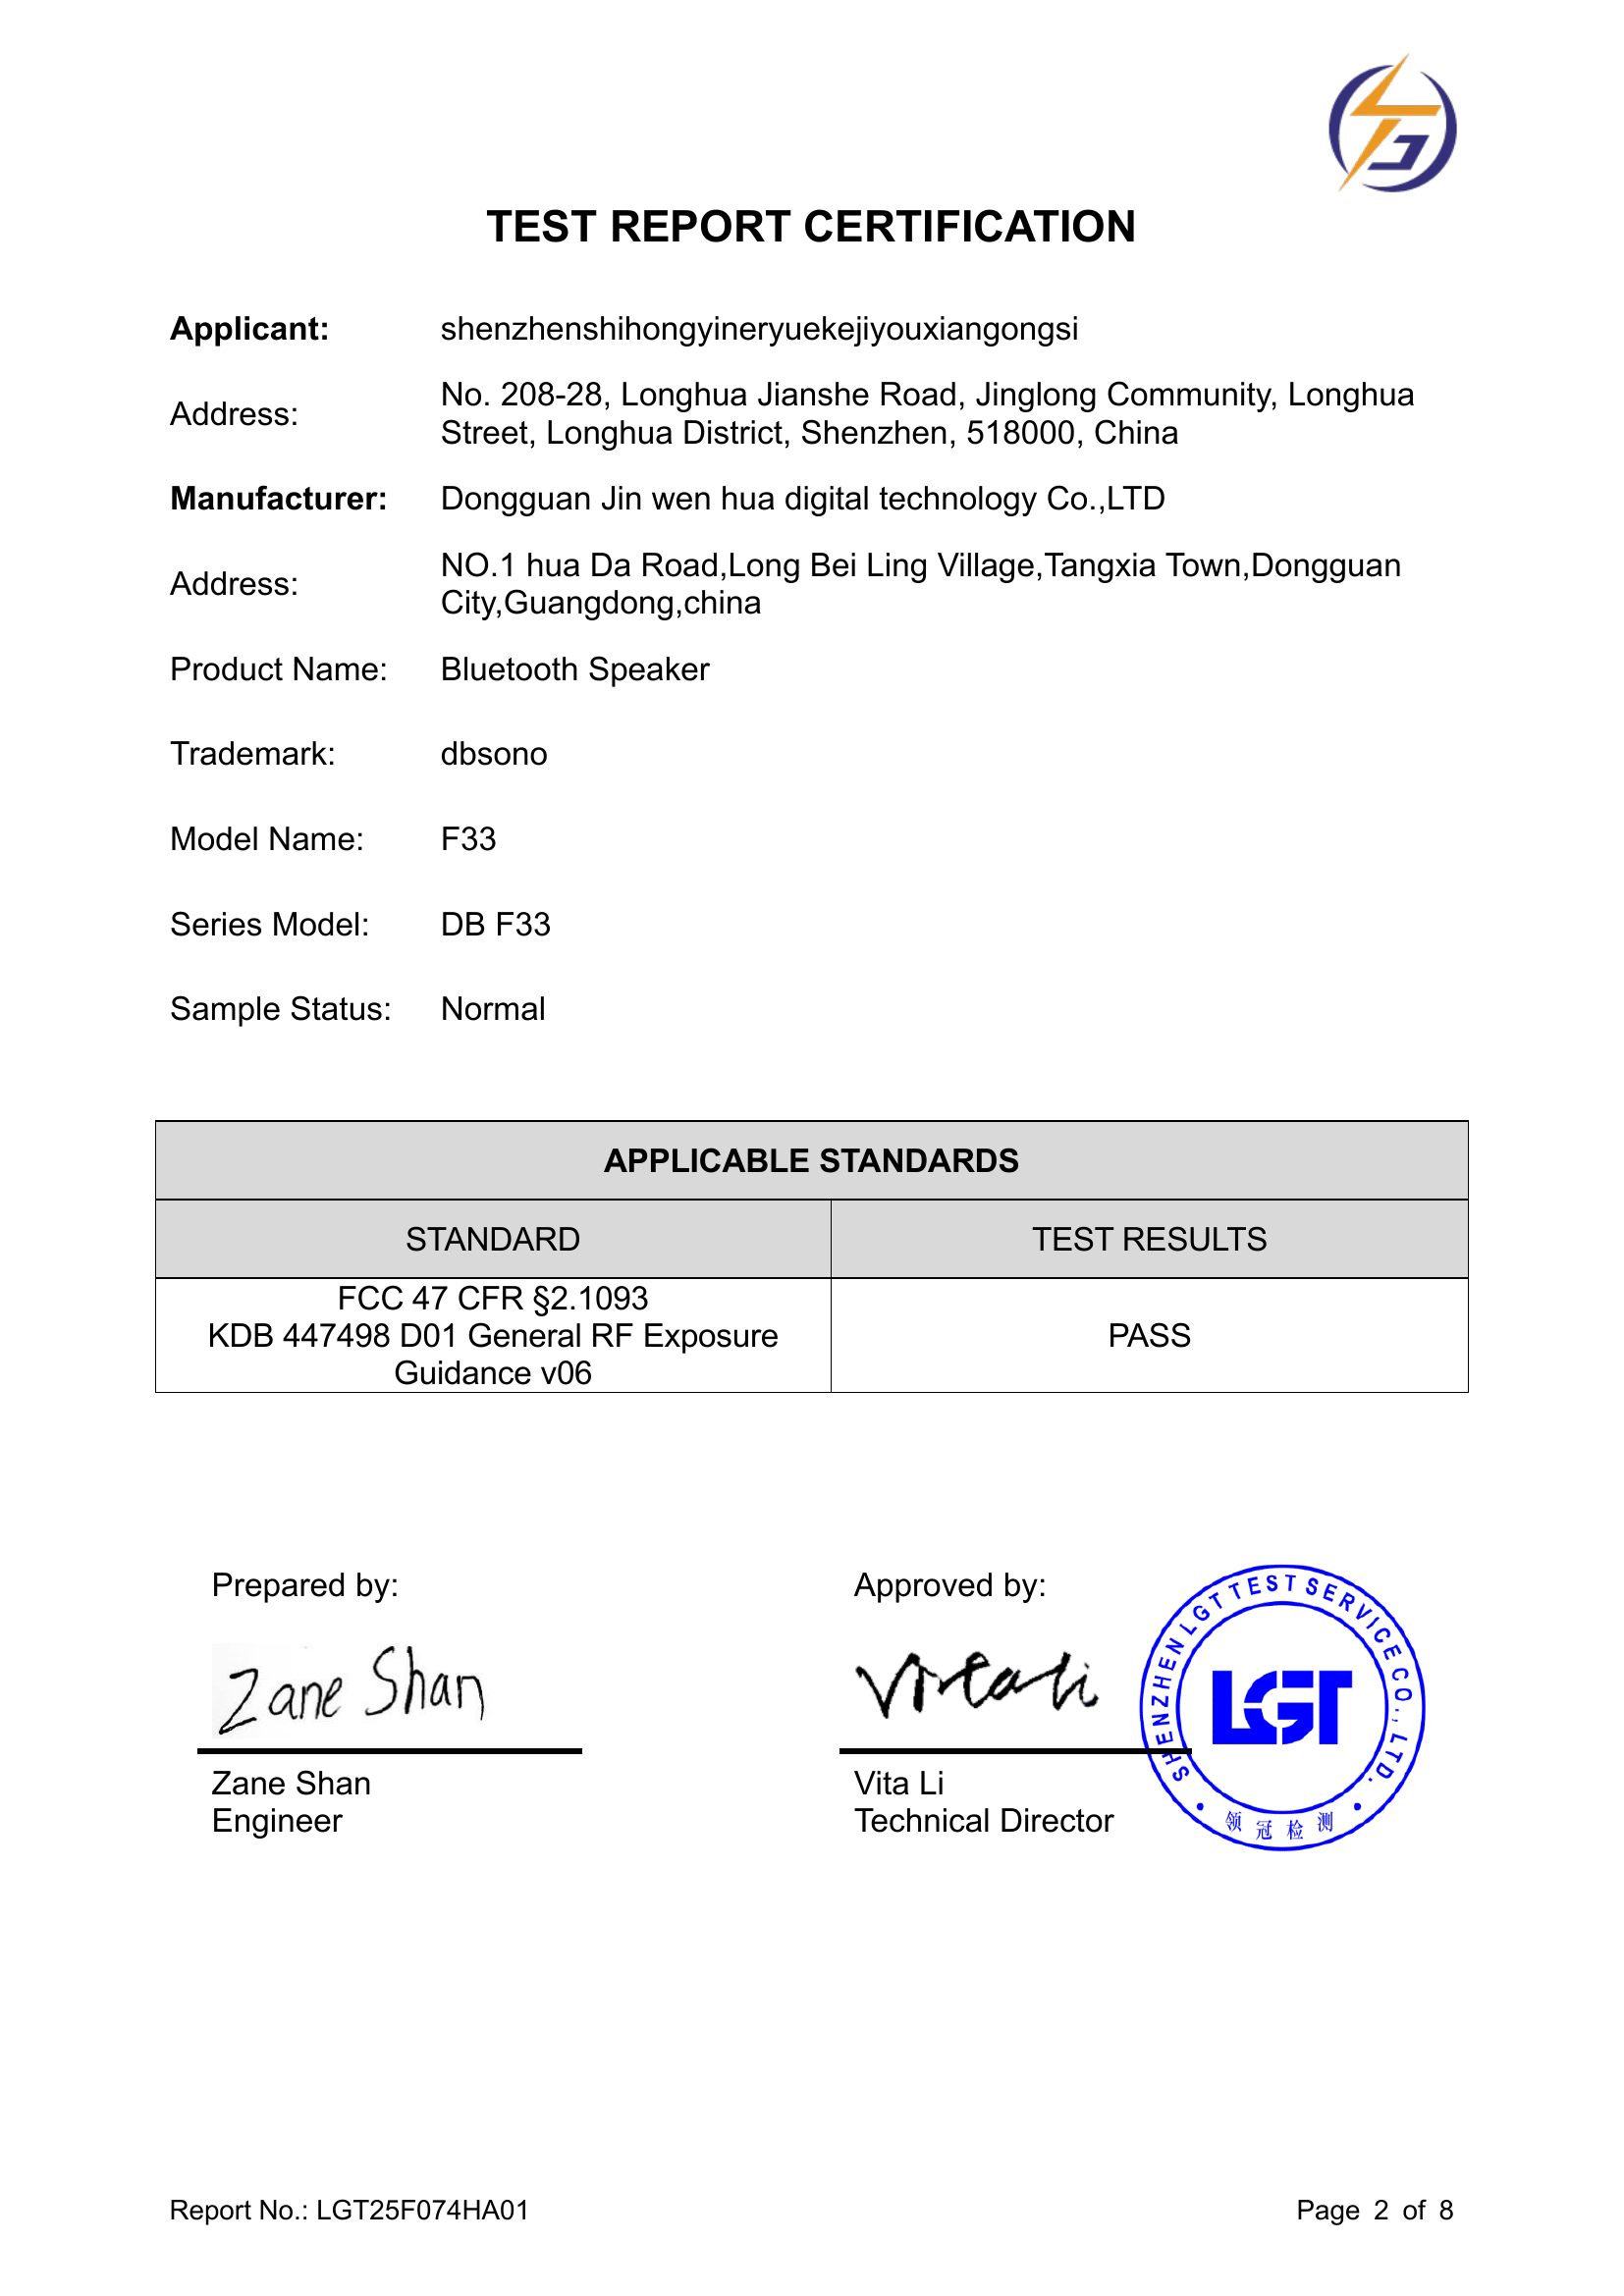
| Trademark | dbsono |
| Main model | F33 |
| Series model | DB F33 |
| Model differences | All models are identical except the Bluetooth name and model number, therefore the test performed on the model F33 |
| Sample condition | Normal |
| Bluetooth frequency band | 2402-2480MHz |
| Rated input | DC 5V 1A |
| Battery capacity | 1200mAh |
| Rated battery voltage | 3.7V |
| Hardware version | V1.1 |
| Software version | 31E4-2029536D |
| Applicant / report recipient | shenzhenshihongyineryuekejiyouxiangongsi |
| Applicant's address | No. 208-28, Longhua Jianshe Road, Jinglong Community, Longhua Street, Longhua District, Shenzhen, 518000, China |
| Manufacturer | Dongguan Jin wen hua digital technology Co.,LTD |
| Manufacturer's address | NO.1 hua Da Road,Long Bei Ling Village,Tangxia Town,Dongguan City,Guangdong,china |
3. Testing Organization and Signatures
| Item | Information |
|---|---|
| Organization name | Shenzhen LGT Test Service Co., Ltd. |
| Organization address | Room 205, Building 13, Zone B, Zhenxiong Industrial Park, No.177, Renmin West Road, Jinsha, Kengzi Street, Pingshan District, Shenzhen, Guangdong, China |
| A2LA Certificate No. | 6727.01 |
| FCC Registration No. | 746540 |
| CAB ID | CN0136 |
| Telephone | 0755-89668180 |
| lgt@lgt-cert.com | |
| Website | www.lgt-cert.com |
| Prepared by | Zane Shan; Engineer; handwritten signature |
| Approved by | Vita Li; Technical Director; handwritten signature |
| Seal | Blue circular seal; text: SHENZHEN LGT TEST SERVICE CO., LTD., LGT, 领冠检测. |
| Organization logo | LGT graphic logo consisting of a blue-purple ring and an orange lightning bolt. |
4. Applicable Standards and Assessment Method
| Standard | Test result |
|---|---|
| FCC 47 CFR §2.1093 KDB 447498 D01 General RF Exposure Guidance v06 | PASS |
The RF exposure assessment follows the maximum permissible exposure (MPE) limits specified in KDB 447498 D01 General RF Exposure Guidance v06. The gain of the antenna used in the product is taken from the supplied antenna data sheet, and the maximum total power input to the antenna is measured. The distance from the product at which the MPE limit is reached is calculated using the Friis transmission equation and the antenna's maximum gain.
The Friis transmission equation assumes far-field conditions, and its calculation overestimates near-field power density. This calculation is used as the worst case to determine the safe range.
5. SAR Test Exemption Conditions and Power Thresholds
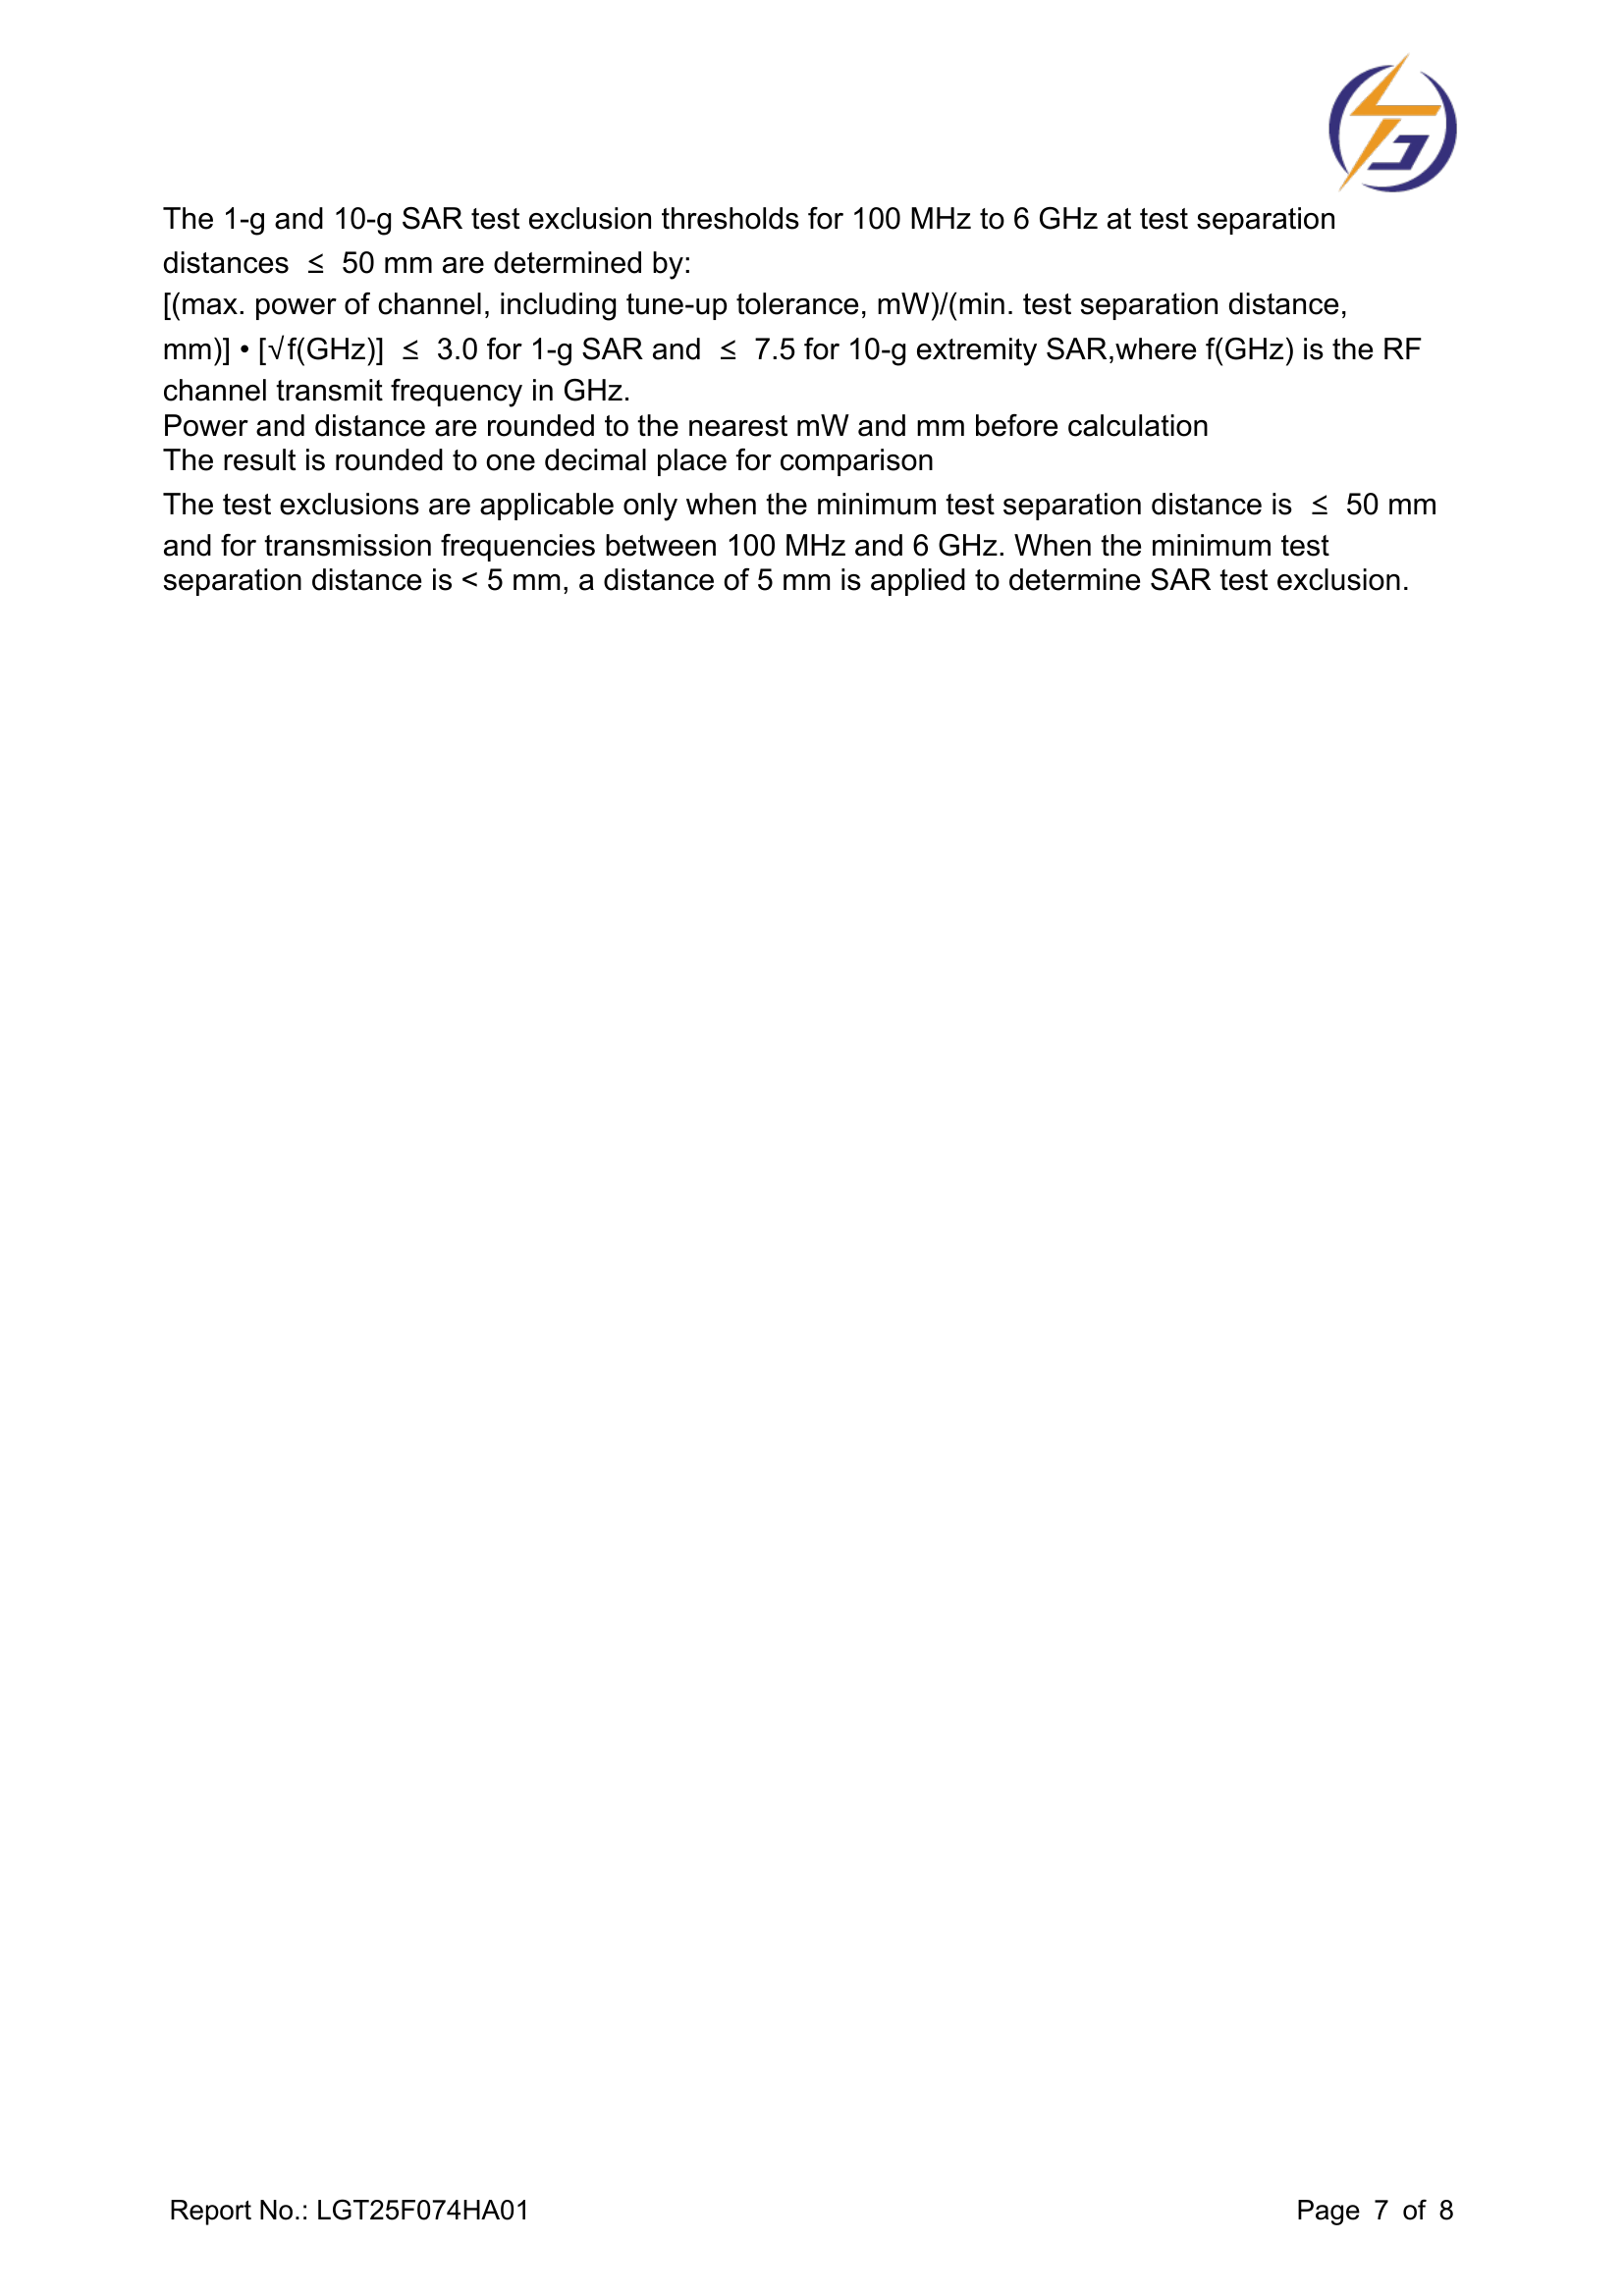
For 100 MHz to 6 GHz and test separation distances not exceeding 50 mm, the 1-g and 10-g SAR test exemption thresholds are determined using:
[Maximum channel power (including tune-up tolerance, mW) ÷ minimum test separation distance (mm)] × √f (GHz)
| Parameter or condition | Requirement |
|---|---|
| 1-g SAR | Calculated value ≤3.0 |
| 10-g extremity SAR | Calculated value ≤7.5 |
| f(GHz) | RF channel transmit frequency expressed in GHz |
| Power and distance rounding | Before calculation, round power to the nearest mW and distance to the nearest mm. |
| Result precision | Round the calculated result to one decimal place before comparison. |
| Applicable frequency | 100 MHz to 6 GHz |
| ** | |
| --- | --- |
| Applicable frequency | 100 MHz to 6 GHz |
| Applicable separation distance | Minimum test separation distance ≤50 mm; when the minimum test separation distance is <5 mm, use 5 mm to determine SAR test exemption. |
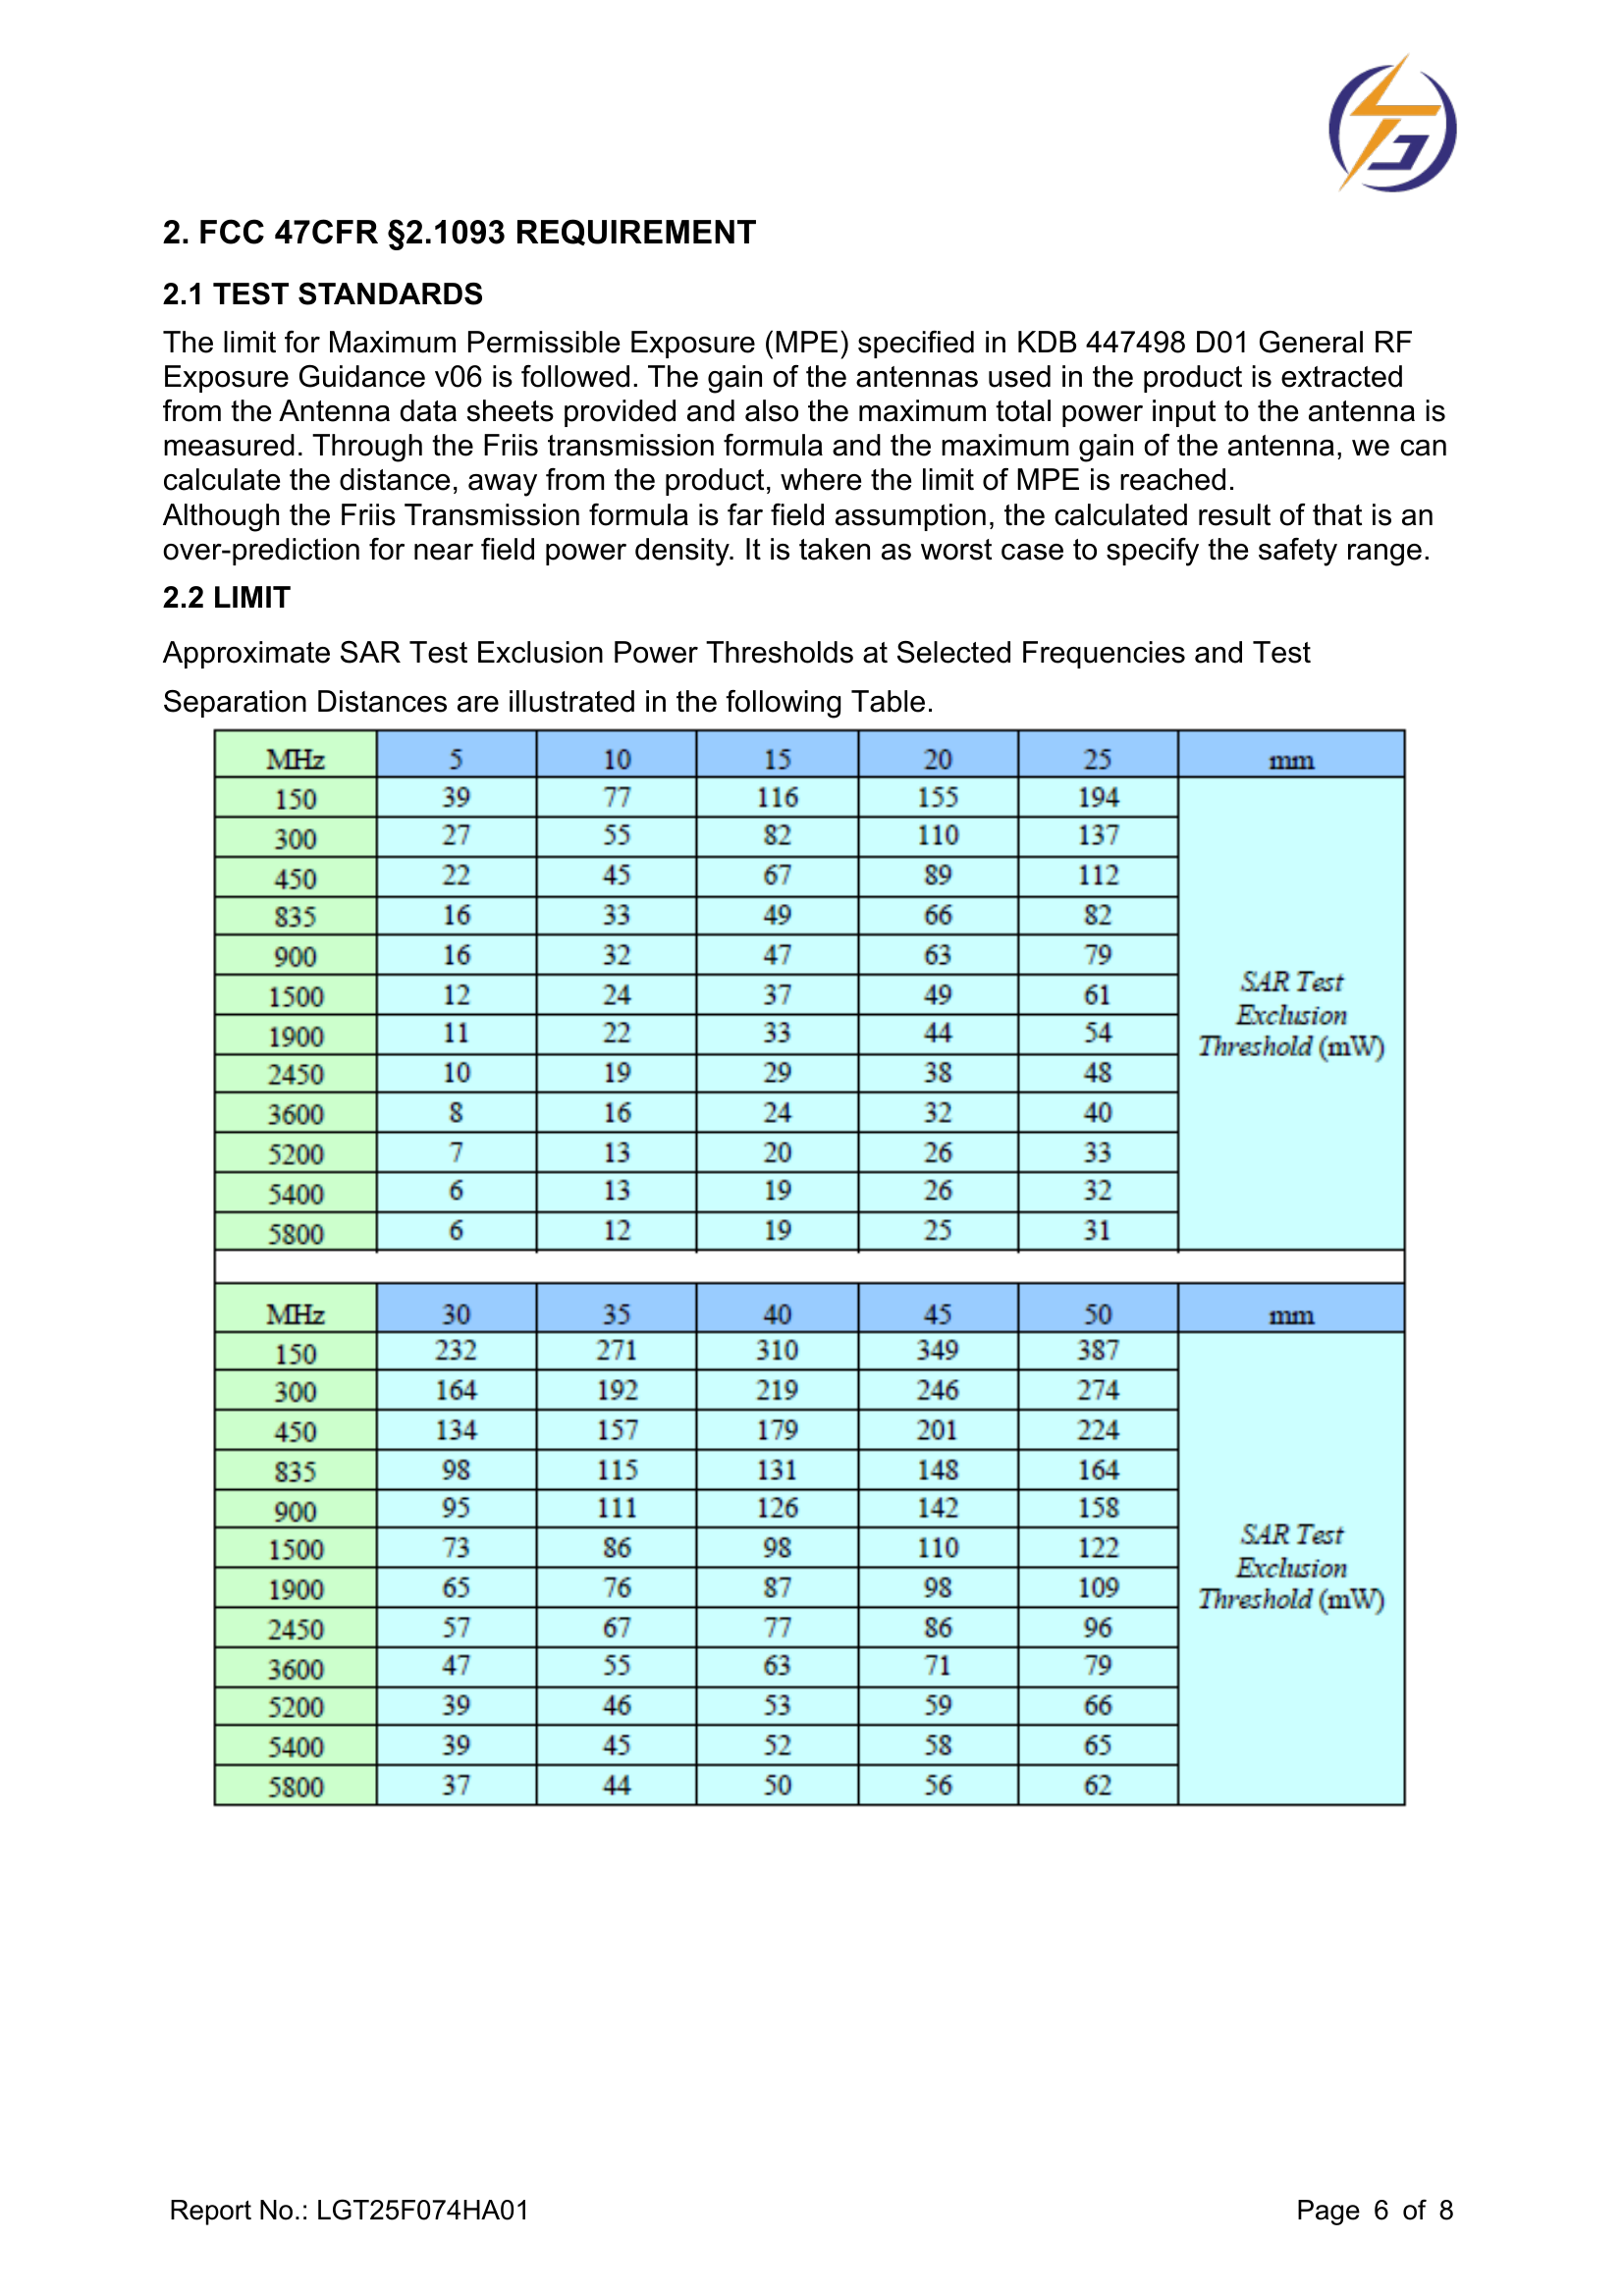
The SAR test exemption power threshold table lists approximate power thresholds at selected frequencies and test separation distances. Rows represent frequency (MHz), columns represent test separation distance (mm), and table values are SAR Test Exclusion Threshold (mW). At a given frequency, the listed power threshold increases with test separation distance; for example, 2450 MHz at 5 mm corresponds to 10 mW, and 2450 MHz at 50 mm corresponds to 96 mW.
| Frequency MHz | 5 mm | 10 mm | 15 mm | 20 mm | 25 mm | 30 mm | 35 mm | 40 mm | 45 mm | 50 mm |
|---|---|---|---|---|---|---|---|---|---|---|
| 150 | 39 | 77 | 116 | 155 | 194 | 232 | 271 | 310 | 349 | 387 |
| 300 | 27 | 55 | 82 | 110 | 137 | 164 | 192 | 219 | 246 | 274 |
| 450 | 22 | 45 | 67 | 89 | 112 | 134 | 157 | 179 | 201 | 224 |
| 835 | 16 | 33 | 49 | 66 | 82 | 98 | 115 | 131 | 148 | 164 |
| 900 | 16 | 32 | 47 | 63 | 79 | 95 | 111 | 126 | 142 | 158 |
| 1500 | 12 | 24 | 37 | 49 | 61 | 73 | 86 | 98 | 110 | 122 |
| 1900 | 11 | 22 | 33 | 43 | 54 | 65 | 76 | 87 | 98 | 109 |
| 2450 | 10 | 19 | 29 | 38 | 48 | 57 | 67 | 77 | 86 | 96 |
| 3600 | 8 | 16 | 24 | 32 | 40 | 47 | 55 | 63 | 71 | 79 |
| 5200 | 7 | 13 | 20 | 26 | 33 | 39 | 46 | 53 | 59 | 66 |
| 5400 | 6 | 13 | 19 | 26 | 32 | 39 | 45 | 52 | 58 | 65 |
| 5800 | 6 | 12 | 19 | 25 | 31 | 37 | 44 | 50 | 56 | 62 |
6. Bluetooth Modes and Assessment Results
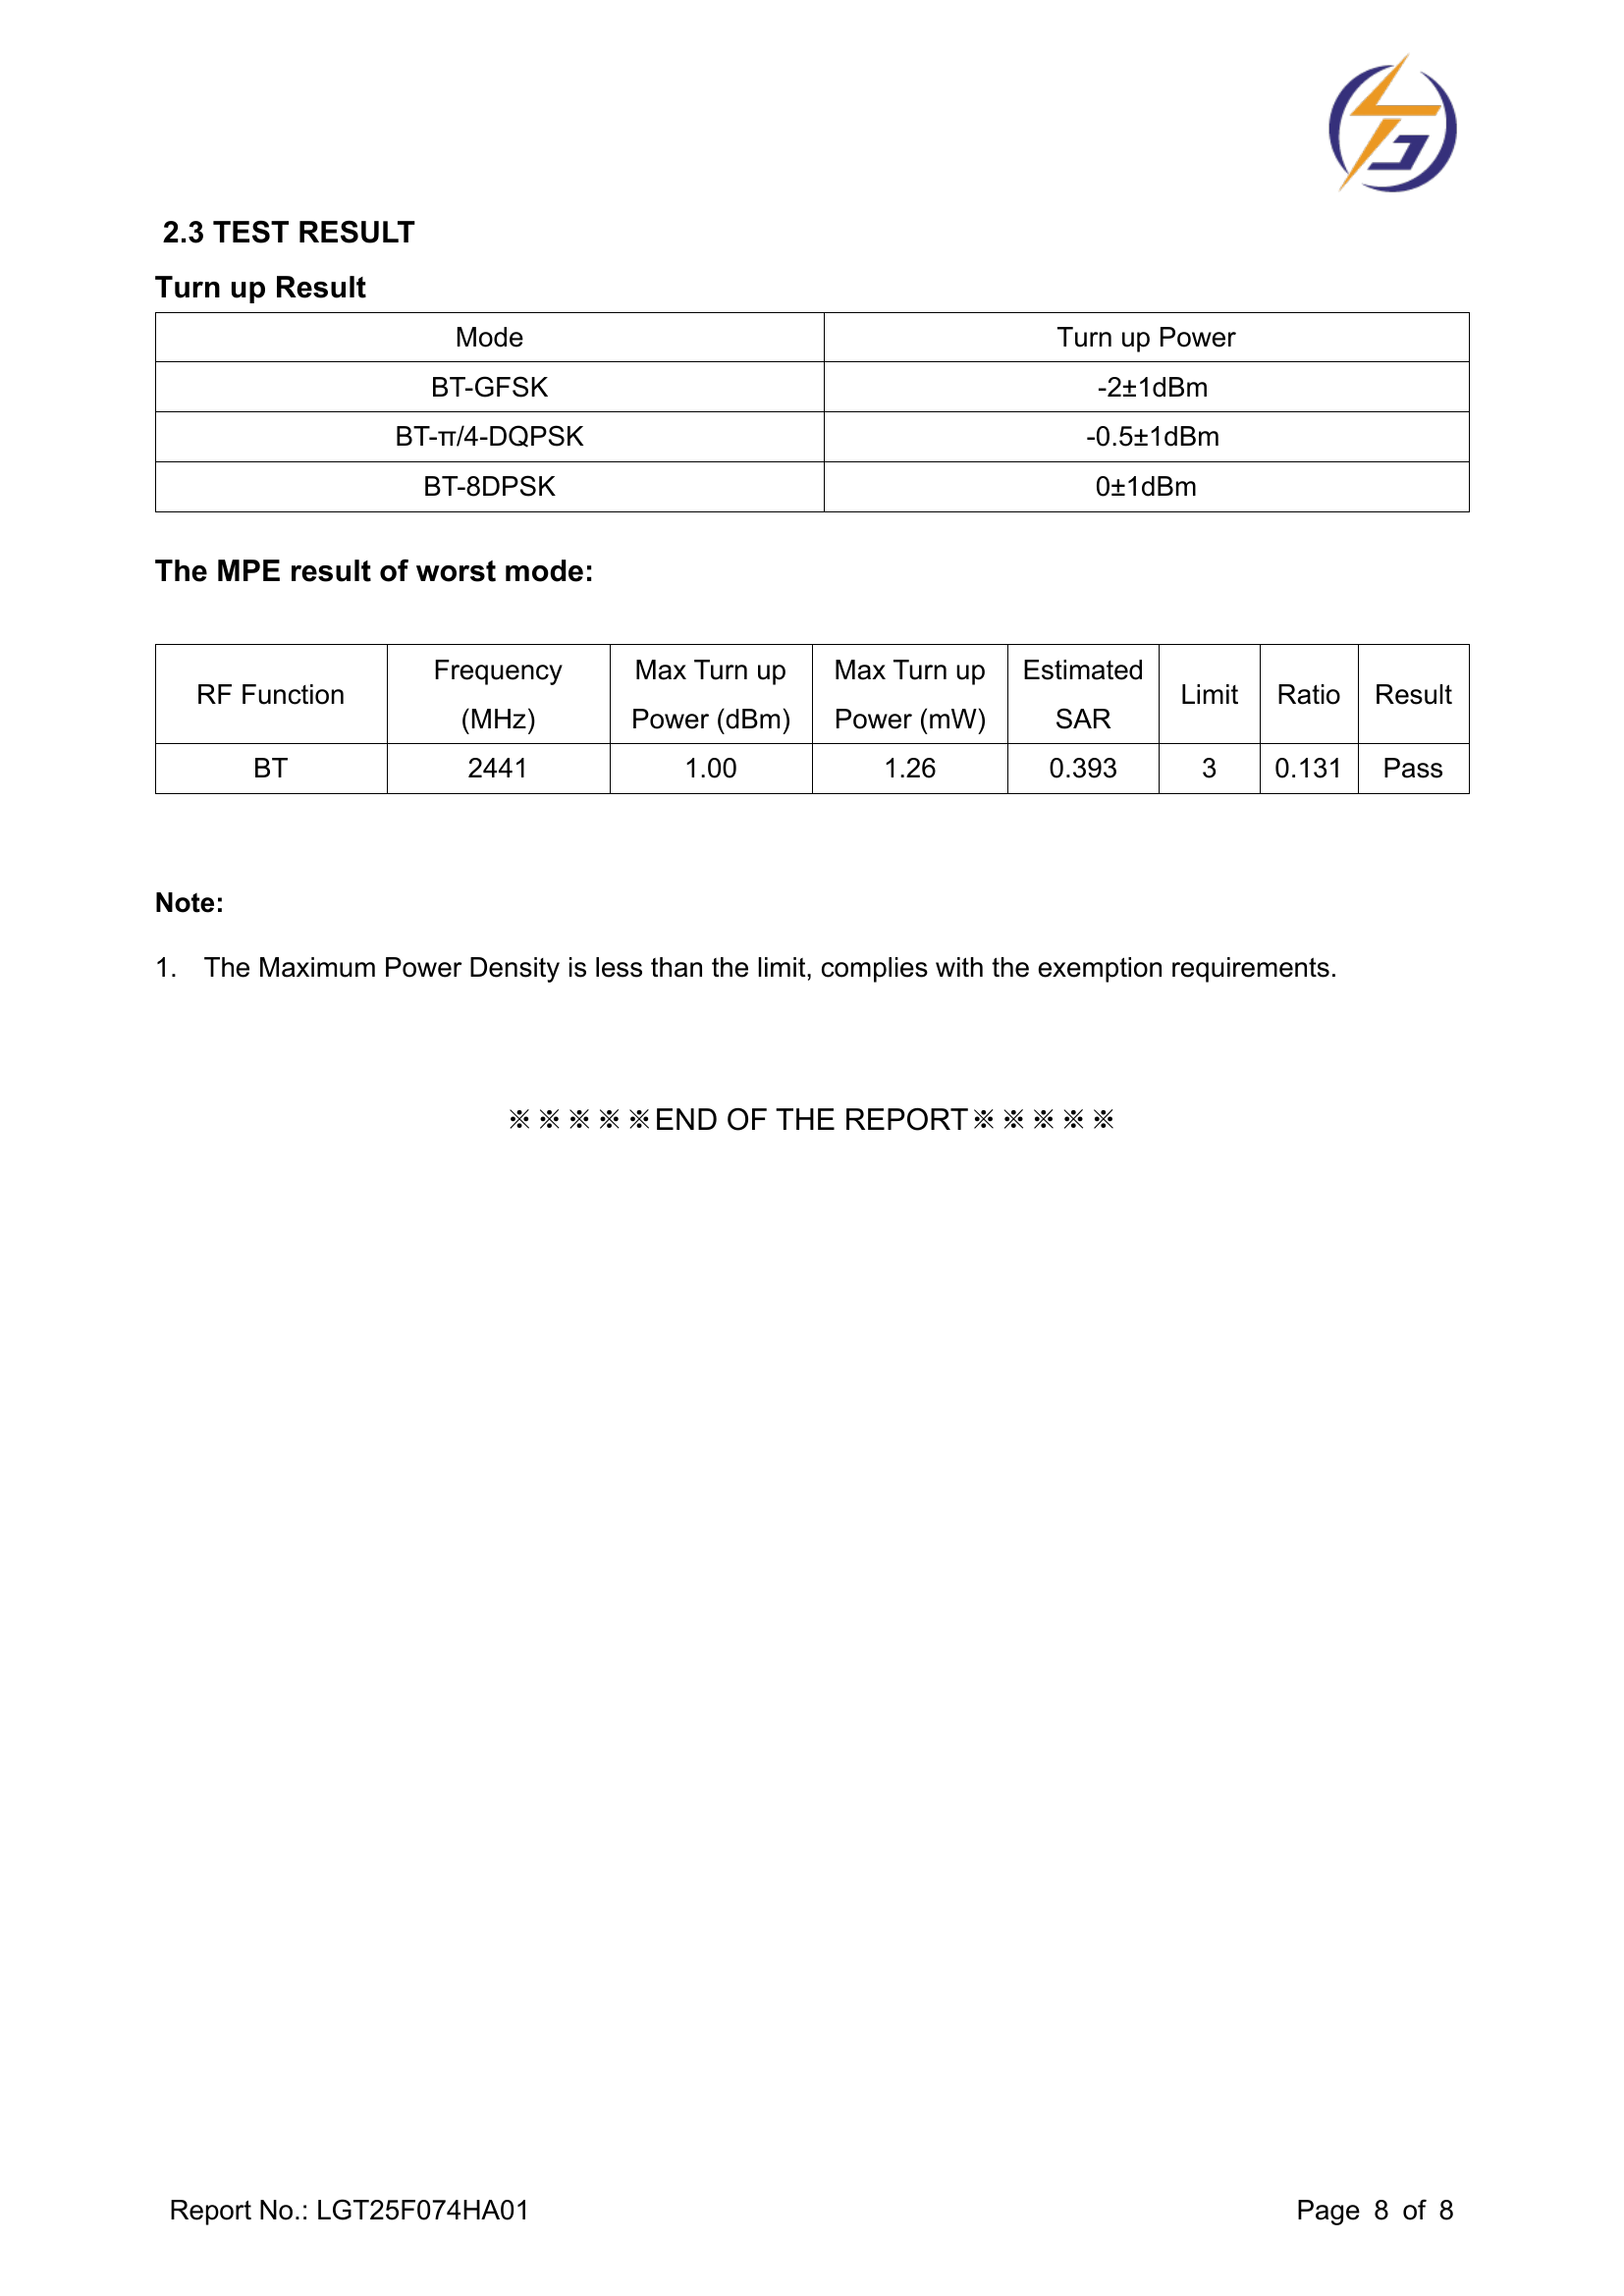
| Mode | Turn up Power |
|---|---|
| BT-GFSK | -2±1dBm |
| BT-π/4-DQPSK | -0.5±1dBm |
| BT-8DPSK | 0±1dBm |
The MPE result of worst mode:
| Parameter | Value |
|---|---|
| RF Function | BT |
| Frequency (MHz) | 2441 |
| Max Turn up Power (dBm) | 1.00 |
| Max Turn up Power (mW) | 1.26 |
| Estimated SAR | 0.393 |
| Limit | 3 |
| Ratio | 0.131 |
| Result | Pass |
The Maximum Power Density is less than the limit, complies with the exemption requirements.
7. Report Images